Using Administrative Data for Policy Evaluation
In-Person Workshop | ADR Evaluation Extension
UCL Centre for Education Policy & Equalising Opportunities
2026-09-17
Today
| 11:00 | Welcome and setup | 15 min |
| 11:15 | Analysing a cluster randomised trial | 105 min |
| 13:00 | Lunch | |
| 13:45 | Difference-in-differences with a policy reform | 120 min |
| 15:45 | Break | |
| 16:00 | Regression discontinuity, if we are on time | 45 min |
| 16:45 | Wrap-up | 15 min |
This is a workshop focussed on implementation of the concepts discussed in the online modules.
How we will work
The code is hidden by default. Every coding slide says what it is for; pick your own level, and change it slide by slide:
- Follow along — open the fold, run the code, work out what it did
- Read first — read the aim, predict what the code will do, then open the fold and run it
- Write your own — read the aim, write it yourself, open the fold to check
- Guided slides: on your own, at the pace on the screen
- “Your turn” tasks: with the person next to you, one keyboard, swap who types each task
- Discussions: in threes
If you are writing your own you will not finish every slide. Don’t worry — each exercise ends with a recap, and there are extensions in the appendix for anyone ahead.
Getting Set Up
What you should already have
- R 4.1 or later, and RStudio or Positron/VSCode
- The workshop project folder — everything is in it, including the data
- The packages we will use:
There is nothing to download and nothing to build. Open the project folder/file and you are ready.
How the code is written
| We use | For |
|---|---|
tidyverse where possible — readr, dplyr, tidyr, ggplot2, and the native pipe \|> |
reading, reshaping, plotting |
fixest::feols() |
regression models |
etable() at the console, modelsummary() for a report |
regression tables |
rdrobust, rddensity |
regression discontinuity design |
| Two colours throughout: unaffected / control and affected / treatment | every plot |
- Use whatever you are fluent in — the point is the estimand, not the syntax. But the folds and the solution scripts are written this way
- If a model call has no
cluster =, the slide is about to show you why it needs one
Run this first, and again after lunch if you restart R:
Where this data comes from
No value here comes from LEO, and none describes a real person. They are constructed to resemble LEO and NPD data but as parameters you estimate were chosen as part of the simulation process.**
- It is simulated from scratch — there is no real extract underneath it, anonymised or otherwise
- What is borrowed is the shape: variable names, codings, formats, plausible distributions, and the awkward bits
- This means we know the right answer: the treatment effect, the intra-cluster correlation, the attrition patterns, etc., so we know what we’re aiming for
- It also means nothing here is a finding. Do not quote a number from today in anything!
The awkward bits are deliberate
| Structural features | Target parameters |
|---|---|
| Variable names, codings and formats | The treatment effect, ICC and attrition rate |
| Plausible marginal distributions | The joint distribution between covariates |
Missing-value patterns and text variables |
Attainment 8 and post-16 destination |
Unexpectedly text variables for numbers |
The size of the discontinuity |
These are realistic odd things about these admin data.
Exercise 1: Analysing a Cluster RCT
The trial
A formative assessment programme delivered to whole schools. 140 secondary schools randomised 70/70, stratified by intake attainment and FSM share. Primary outcome: GCSE Attainment 8, linked from the National Pupil Database.
Modelled on Anders et al. (2022), the example used in Modules 1 and 2.
- Randomisation is at the school-level; the outcome is measured at the pupil-level
- The evaluation team generated the randomisation list; they were linked up with the NPD outcomes
- Protocol MDES was 0.18 SD
Load the trial data
#> [1] 25877 13#> [1] 138 11#> [1] 140 5Three files. Which are from the evaluation team, and are the matches from the National Pupil Database?
#> Rows: 25,877
#> Columns: 13
#> $ pupil_id         <chr> "P000001", "P000002", "P000003", "P000004", "P000005", "P000006…
#> $ school_urn       <dbl> 125331, 125331, 125331, 125331, 125331, 125331, 125331, 125331,…
#> $ arm              <chr> "treatment", "treatment", "treatment", "treatment", "treatment"…
#> $ ks2_score        <dbl> 109, 98, 91, NA, 94, 115, 106, 106, 111, 109, 100, 108, 119, 11…
#> $ gender           <chr> "F", "M", "M", "M", "F", "F", "M", "F", "M", "F", "M", "F", "M"…
#> $ ethnic           <chr> "WBRI", "WBRI", "BAFR", "WBRI", "OOTH", "APKN", "WBRI", "WBRI",…
#> $ fsm6             <dbl> 0, 0, 0, 0, 1, 0, 0, 0, 0, 0, 0, 0, 0, 0, 0, 0, 0, 0, 0, 0, 0, …
#> $ sen_support      <dbl> 0, 0, 0, 0, 1, 0, 0, 0, 0, 0, 0, 0, 0, 0, 0, 0, 0, 0, 0, 1, 0, …
#> $ eal              <dbl> 0, 1, 0, 0, 0, 1, 1, 0, 0, 0, 0, 0, 0, 0, 0, 1, 0, 0, 1, 1, 0, …
#> $ idaci_rank       <dbl> 30313, 15780, 4710, 21568, 9114, 19065, 5446, 23083, 30487, 253…
#> $ attainment8      <dbl> 22, 34, 37, 38, 42, 82, 57, 49, 64, 65, 34, 46, 57, 68, 80, 68,…
#> $ destination_code <dbl> 120, 130, 110, 540, 130, 710, 220, 110, 220, 610, 130, 120, 120…
#> $ linked <dbl> 1, 1, 1, 1, 1, 1, 1, 1, 1, 1, 1, 1, 1, 1, 1, 1, 1, 1, 1, 1, 1, …Does the data match the design?
Aim: count the schools in the randomisation list and in the pupil file, then list the schools that are in one but not the other, with their block and arm.
Before any analysis, check the file you were sent is the file you expected. What could explain a gap? Which explanations would be concerning?
#> [1] 140#> [1] 138#> # A tibble: 2 × 3
#> school_urn block arm
#> <dbl> <chr> <chr>
#> 1 113849 mid attainment / high FSM treatment
#> 2 128542 mid attainment / high FSM treatmentChecking balance
Aim: the mean of each baseline characteristic by arm, in one table.
Randomisation makes the arms comparable in expectation. Balance tables are how you show it worked this time. The rule for what goes in: measured before randomisation, or fixed.
Show the code
#> # A tibble: 2 × 7
#>   arm           n `KS2 score` `% FSM6` `% SEN` `% EAL` `IDACI rank`
#>   <chr>     <dbl>       <dbl>    <dbl>   <dbl>   <dbl>        <dbl>
#> 1 control   12478        104      28.7    13.5    20.7       16806.
#> 2 treatment 13399 104. 26 15.6 18.4 16236.Does balance need a test?
- The randomisation was random, so any imbalance is by definition chance
- What matters is not significance but magnitude: is the imbalance big enough to move the outcome?
- Adjust for (pre-specified) baseline covariates that strongly predict the outcome whether or not they look imbalanced — it buys precision
Pairs — 10 minutes
Add one more characteristic of your choice to the balance table — try gender, or the school-level pct_fsm6. Does anything look concerning?
Intention to treat: the analysis sample
Intention to treat. Compare pupils by the arm their school was assigned to, regardless of what the school actually did.
Aim: keep the pupils with an NPD record, and attach each school’s stratification block from the randomisation list.
Show the code
#> [1] 25336- We drop only pupils with no NPD record at all — a linkage failure, not a treatment response
- We do not drop pupils whose school delivered the programme badly.
- That would be per-protocol, and it undermines randomisation. Use CACE/IV instead (not covered in this workshop).
Unadjusted difference in means
Two things to notice in the call: the outcome, and cluster =. Why school?
#> OLS estimation, Dep. Var.: attainment8
#> Observations: 25,336
#> Standard-errors: Clustered (school_urn)
#>              Estimate Std. Error   t value  Pr(>|t|)
#> (Intercept)  45.66084    1.14567 39.855027 < 2.2e-16 ***
#> armtreatment  1.31436    1.54605  0.850142   0.39673
#> ---
#> Signif. codes:  0 '***' 0.001 '**' 0.01 '*' 0.05 '.' 0.1 ' ' 1
#> RMSE: 18.7 Adj. R2: 0.00119Add prior attainment
Aim: refit the model with KS2 prior attainment as a covariate.
Reminder: why are we including a baseline covariate in a randomised trial anyway? Not bias: randomisation handled that. It is there to soak up variation in the outcome that has nothing to do with the treatment. So useful baseline covariates predict the outcome strongly (sometimes called prognostic) and was measured before randomisation.
Which of these do you expect to change, and in which direction?
- estimate,
- standard error
- R²
Show the code
#> OLS estimation, Dep. Var.: attainment8
#> Observations: 24,663
#> Standard-errors: Clustered (school_urn)
#>                Estimate Std. Error   t value  Pr(>|t|)
#> (Intercept)  -137.86785   3.101478 -44.45231 < 2.2e-16 ***
#> armtreatment    1.99693   0.846617   2.35871  0.019751 *
#> ks2_score       1.76468   0.028748  61.38375 < 2.2e-16 ***
#> ---
#> Signif. codes:  0 '***' 0.001 '**' 0.01 '*' 0.05 '.' 0.1 ' ' 1
#> RMSE: 14.1 Adj. R2: 0.442456Add pupil characteristics and the blocks
Aim: add FSM6, SEN support and EAL as covariates, and the stratification blocks as fixed effects.
Once prior attainment is included, what must a covariate do to add precision? Will three demographics buy as much as prior attainment did?
Why should we include the stratification blocks?
Show the code
#> OLS estimation, Dep. Var.: attainment8
#> Observations: 24,663
#> Fixed-effects: block: 9
#> Standard-errors: Clustered (school_urn)
#>              Estimate Std. Error   t value   Pr(>|t|)
#> armtreatment  1.88677   0.804085   2.34648 2.0385e-02 *
#> ks2_score     1.55190   0.023139  67.06892  < 2.2e-16 ***
#> fsm6         -6.29411   0.282203 -22.30349  < 2.2e-16 ***
#> sen_support  -6.63235   0.323425 -20.50661  < 2.2e-16 ***
#> eal           2.15896   0.524767   4.11413 6.6716e-05 ***
#> ---
#> Signif. codes:  0 '***' 0.001 '**' 0.01 '*' 0.05 '.' 0.1 ' ' 1
#> RMSE: 13.6     Adj. R2: 0.481451
#> Within R2: 0.41864Three specifications, one table
Aim: the three models in one table — the treatment row only, with N and R².
Compare the standard errors.
Show the code
modelsummary(
    ## Avoid a leading "+" in the names: markdown renders it as a bullet.
    list(
        "Unadjusted" = m1, "With prior attainment" = m2,
        "With characteristics and blocks" = m3
    ),
    coef_map = c("armtreatment" = "Treatment"),
    gof_map = c("nobs", "r.squared"),
    statistic = "({std.error})",
    stars = TRUE, output = "markdown"
)| Unadjusted | With prior attainment | With characteristics and blocks | |
|---|---|---|---|
| Treatment | 1.314 | 1.997* | 1.887* |
| (1.546) | (0.847) | (0.804) | |
| Num.Obs. | 25336 | 24663 | 24663 |
| R2 | 0.001 | 0.443 | 0.482 |
|
|||
The precision gain
Pairs — 15 minutes
Compute how much the standard error fell, and convert both estimates into effect sizes.
Show the code
sd_a8 <- sd(analysis$attainment8, na.rm = TRUE)

tibble(
    model     = c("Unadjusted", "Adjusted"),
    estimate  = c(coef(m1)[["armtreatment"]], coef(m3)[["armtreatment"]]),
    se        = c(se(m1)[["armtreatment"]], se(m3)[["armtreatment"]]),
    p         = c(pvalue(m1)[["armtreatment"]], pvalue(m3)[["armtreatment"]])
) |>
    mutate(
        effect_size = estimate / sd_a8,
        across(where(is.numeric), \(x) round(x, 3))
    )
#> # A tibble: 2 × 5
#> model estimate se p effect_size
#> <chr> <dbl> <dbl> <dbl> <dbl>
#> 1 Unadjusted 1.31 1.55 0.397 0.07
#> 2 Adjusted 1.89 0.804 0.02 0.101Why clustering matters here
Aim: refit the adjusted model with plain (iid) standard errors, and put it beside the clustered one.
Which of the estimate and the standard error will change?
Show the code
naive <- feols(attainment8 ~ arm + ks2_score + fsm6 + sen_support + eal | block,
    data = analysis, vcov = "iid"
)

modelsummary(
    list("Ignoring clustering" = naive, "Clustered by school" = m3),
    coef_map = c("armtreatment" = "Treatment"),
    gof_map = "nobs", statistic = "({std.error})", output = "markdown"
)| Ignoring clustering | Clustered by school | |
|---|---|---|
| Treatment | 1.887 | 1.887 |
| (0.174) | (0.804) | |
| Num.Obs. | 24663 | 24663 |
- Same estimate. Very different standard error.
Intra-cluster correlation and the design effect
Aim: estimate the intra-cluster correlation (ICC) of Attainment 8 — the share of its variance that sits between schools — from a one-way ANOVA on school; then the design effect.
Show the code
#> [1] 0.199#> [1] 37.3- ICC around 0.20, average cohort about 185 pupils
- Design effect near 37 — 25,000 pupils providing roughly the information of 680 independent ones
- Could also estimate the ICC with a hierarchical model - keeping required packages to a minimum!
Small numbers of clusters
- Cluster-robust standard errors are asymptotic in the number of clusters, not the number of pupils
- With 138 schools we are comfortable. Below roughly 30–40, they over-reject — a theoretically 5% test can reject 15% of the time
- Alternative methods such as wild cluster bootstrap (not done here)
Pairs — 10 minutes
Re-estimate m3 on a subset of just 20 schools. What happens to the standard error, and would you trust the p-value?
Show the code
#>   Estimate Std. Error    t value   Pr(>|t|)
#> 0.193 2.548 0.076 0.941Attrition: how much, and is it differential?
Aim: for each arm, the number of pupils with no linked outcome and the share.
Which important things about attrition does this table tell us?
What important thing about attrition does it not tell us?
Who is missing?
Aim: baseline means for linked and unlinked pupils, side by side.
If the two groups differ, what is threatened — and does the answer depend on whether they also differ by arm?
Show the code
#> # A tibble: 2 × 6
#>   linked     n   ks2 pct_fsm6 pct_sen pct_eal
#>    <dbl> <int> <dbl>    <dbl>   <dbl>   <dbl>
#> 1      0   541  104.     32.7    16.3    27.4
#> 2 1 25336 104. 27.2 14.6 19.4What to do about missing outcomes
- Primary specification: complete cases with covariate adjustment. Under missing-at-random given the covariates already in the model, this is unbiased and needs nothing extra
- Multiple imputation as a sensitivity analysis especially when there are additional predictors of missingness not in the analysis model
- Impute separately by arm, or at minimum include treatment and its interactions
- Do not forget missing values int he baseline, too: 673 pupils have no KS2 score and are silently dropped by every adjusted model above
Interpreting this for a funder
What we found: an effect of about 0.10 SD on Attainment 8, clearly distinguishable from zero once we adjust for prior attainment, and estimated on 138 schools with 2.1% missing outcomes.
- Is 0.10 SD big? Roughly a month of additional progress — modest, but comparable to many things schools spend money on
- The trial was designed to detect 0.18 SD. We found something smaller and still called it significant — because adjustment gave us more precision than the design assumed
- The unadjusted analysis would have reported no strong evidence. Importantly the specification with prior attainment covariates was pre-specified.
What you actually recovered
Because we built this dataset, we know the right answers:
| We set | You estimated | |
|---|---|---|
| Treatment effect | 0.10 SD | 0.10 SD adjusted; 0.07 SD unadjusted |
| ICC | 0.20 | 0.20 |
| Attrition | ~2%, non-differential | 1.96% vs 2.21% |
- The adjusted estimate recovers the simulated ‘truth’. The unadjusted one is 30% lower and non-significant by chance alone (both are unbiased) but that chance is higher without adjustment because the standard error is bigger.
- Reported without its pre-specified adjustment, this trial would have been reported as a null finding. Same data, same truth.
Exercise 1: what you did
- Checked the data you were sent matched the design: found two schools missing
- Built a balance table and discussed whether it needs significance tests
- Estimated an intention-to-treat effect and showed how pre-specified adjustment can change the conclusion
- Clustered at the level of randomisation, and saw the consequences of ignoring that
- Distinguished attrition that is non-random from attrition that is differential
If you are ahead — four extensions in the appendix: the pre-specified FSM subgroup, multiple imputation with mice, randomisation inference, and whether the models are even on the same sample.
Exercise 2: Difference-in-Differences
The reform
The SASE reform, August 2012. From that date, every new apprenticeship framework had to last at least 12 months and include at least 280 guided learning hours.
Frameworks already meeting those thresholds were unaffected. Frameworks below them had to change.
- That gives us a comparison group defined by the policy itself — not by our choice
- Outcomes: how many people start, whether they complete, whether they achieve, and what they earn afterwards
- Modelled on Nafilyan & Speckesser (2019), using ILR-style records 2008/09–2015/16
The ILR starts file
#> [1] 120001 19#> [1] "learner_id" "framework_id" "academic_year"
#> [4] "start_year" "sex" "ethnicity"
#> [7] "lldd" "prior_attain" "age_at_start"
#> [10] "start_date" "expected_end_date" "planned_duration_months"
#> [13] "guided_learning_hours" "compstatus" "outcome"
#> [16] "completion" "achievement" "earnings_12m"
#> [19] "main_sic_section"What is not in this file that the design needs?
Who was affected?
Pairs — 10 minutes
The reform applied to frameworks whose planned duration was under 12 months before August 2012. Work out which frameworks those are, using only pre-reform starts.
Show the code
#> # A tibble: 2 × 2
#>   affected     n
#>      <int> <int>
#> 1        0    38
#> 2 1 42First stage: did planned durations change?
Aim: mean planned duration by affected group and start year, as a line plot with the reform marked.
What must this plot show before any effect estimate is believable?
Show the code
starts |>
    left_join(framework_pre, by = "framework_id") |>
    group_by(start_year, affected = factor(
        affected, 0:1,
        c("Unaffected", "Affected")
    )) |>
    summarise(duration = mean(planned_duration_months), .groups = "drop") |>
    ggplot(aes(start_year, duration, colour = affected)) +
    geom_vline(xintercept = 2011.5, linetype = "dashed", colour = "grey50") +
    geom_hline(yintercept = 12, linetype = "dotted", colour = "grey50") +
    geom_line(linewidth = 1) +
    geom_point(size = 2) +
    scale_colour_manual(values = c(Unaffected = "#30d6ff", Affected = "#993bff")) +
    labs(x = NULL, y = "Mean planned duration (months)", colour = NULL)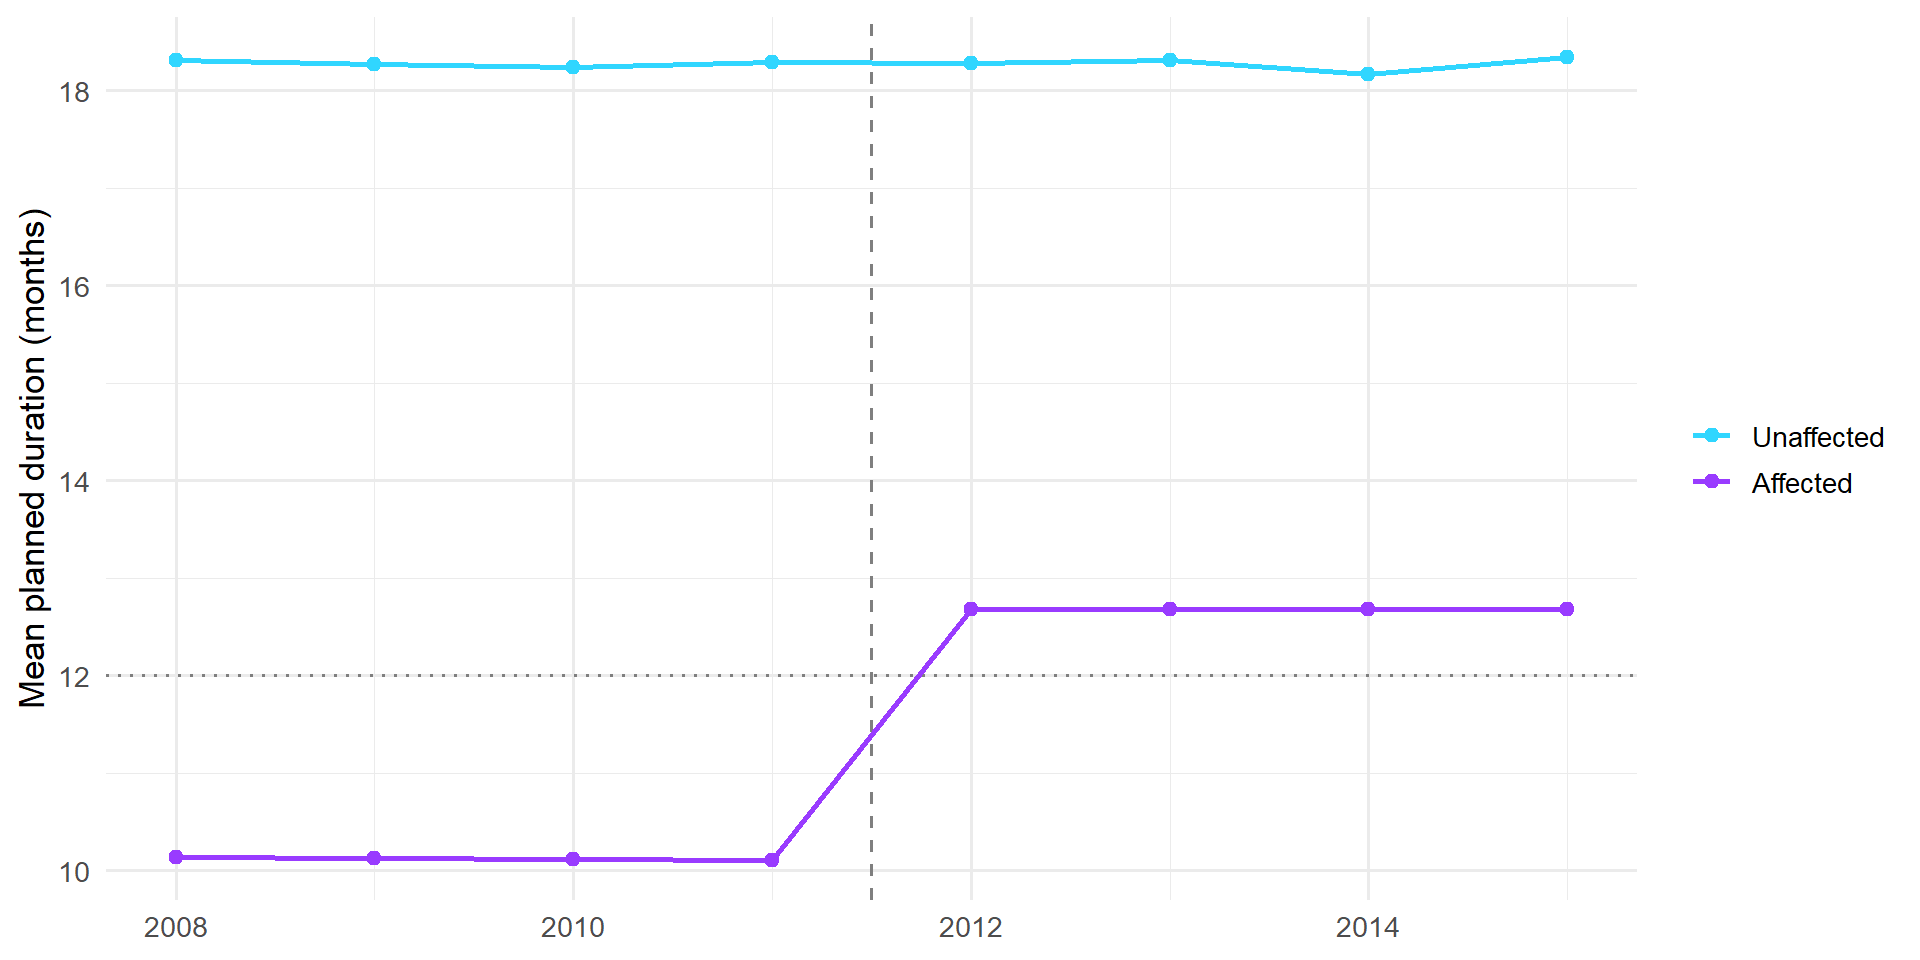
Build the analysis panel
Aim: attach affected to every start, flag post-reform starts and their interaction, then collapse to one row per framework × year: the number of starts, the completion and achievement rates, the mean of log earnings among completers — and how many completers that mean is over.
Why aggregate at all, and what does a cell mean hide?
Show the code
panel <- starts |>
    left_join(framework_pre, by = "framework_id") |>
    mutate(
        post = as.integer(start_year >= 2012),
        did = affected * post
    ) |>
    group_by(framework_id, start_year, affected, post, did) |>
    summarise(
        starts = n(),
        completion = mean(completion),
        achievement = mean(achievement),
        n_earn = sum(!is.na(earnings_12m)),
        log_earn = mean(log(earnings_12m), na.rm = TRUE),
        .groups = "drop"
    )

dim(panel)
#> [1] 640 10Parallel trends, by eye
Aim: the completion rate by group and start year, plotted.
Write one sentence assessing the pre-period before the next slide.
Show the code
panel |>
    group_by(start_year, affected = factor(
        affected, 0:1,
        c("Unaffected", "Affected")
    )) |>
    summarise(completion = mean(completion), .groups = "drop") |>
    ggplot(aes(start_year, completion, colour = affected)) +
    geom_vline(xintercept = 2011.5, linetype = "dashed", colour = "grey50") +
    geom_line(linewidth = 1) +
    geom_point(size = 2) +
    scale_colour_manual(values = c(Unaffected = "#30d6ff", Affected = "#993bff")) +
    labs(x = NULL, y = "Completion rate", colour = NULL)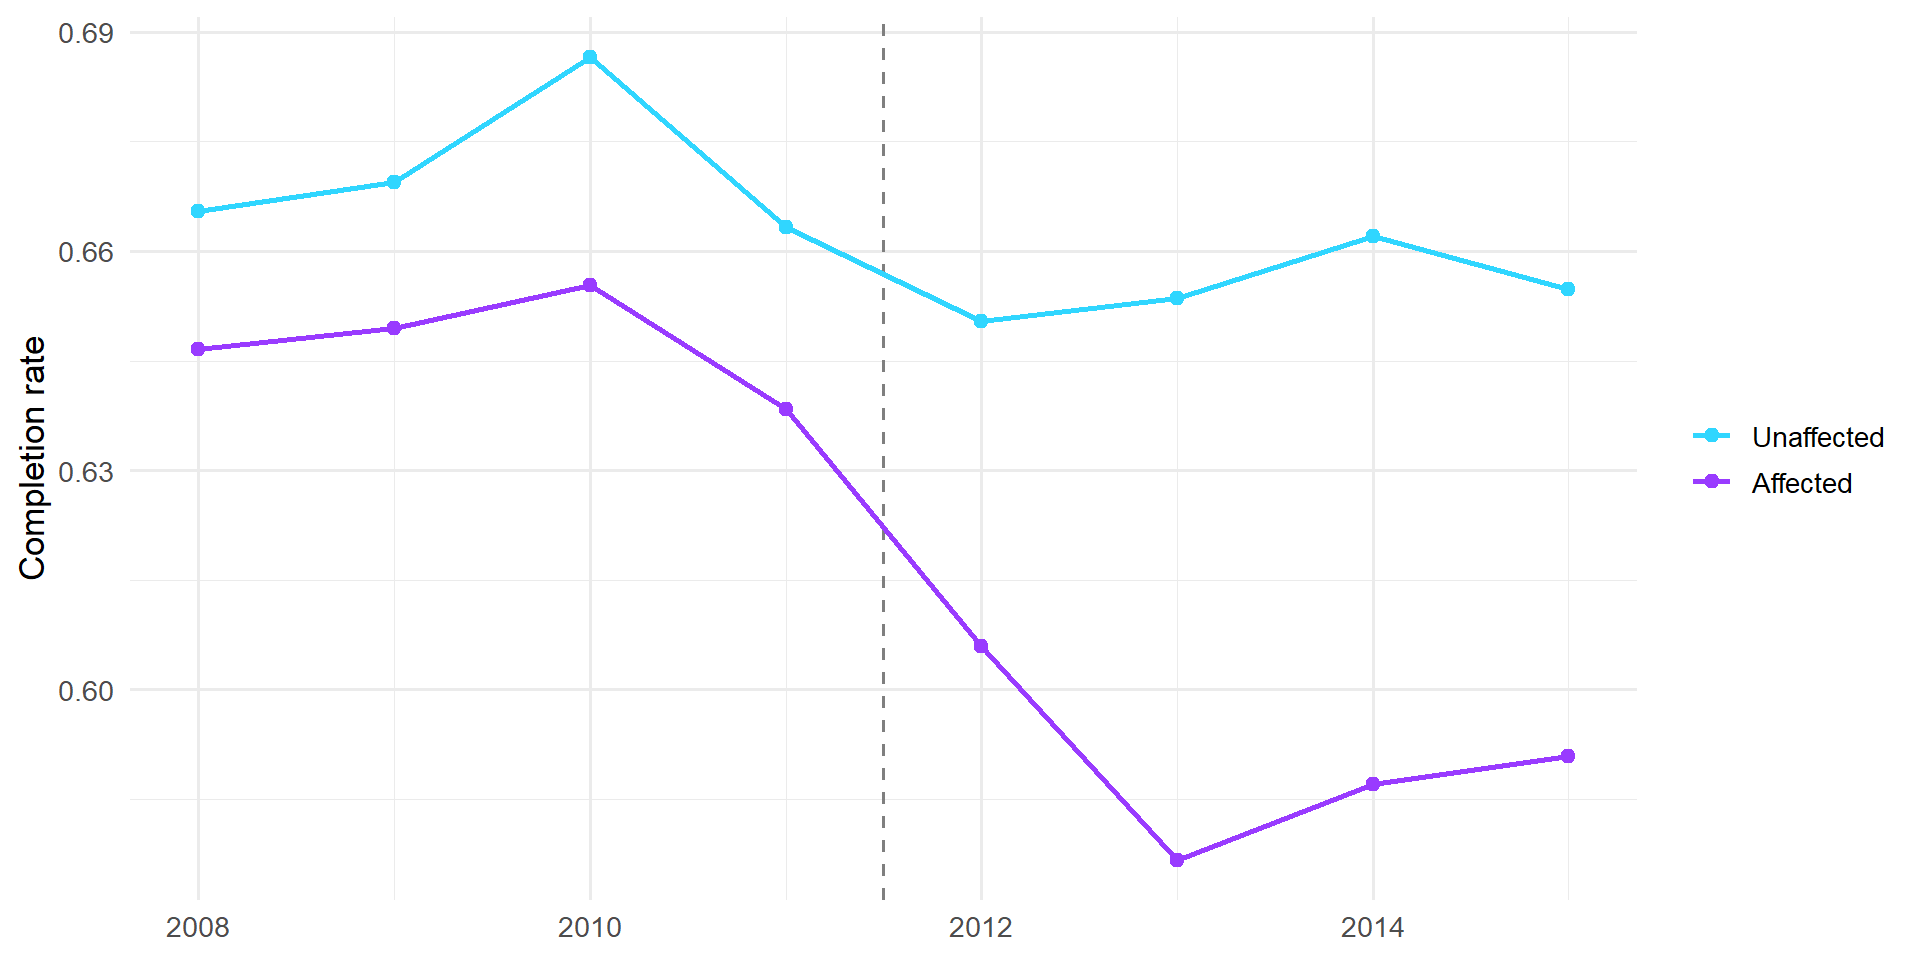
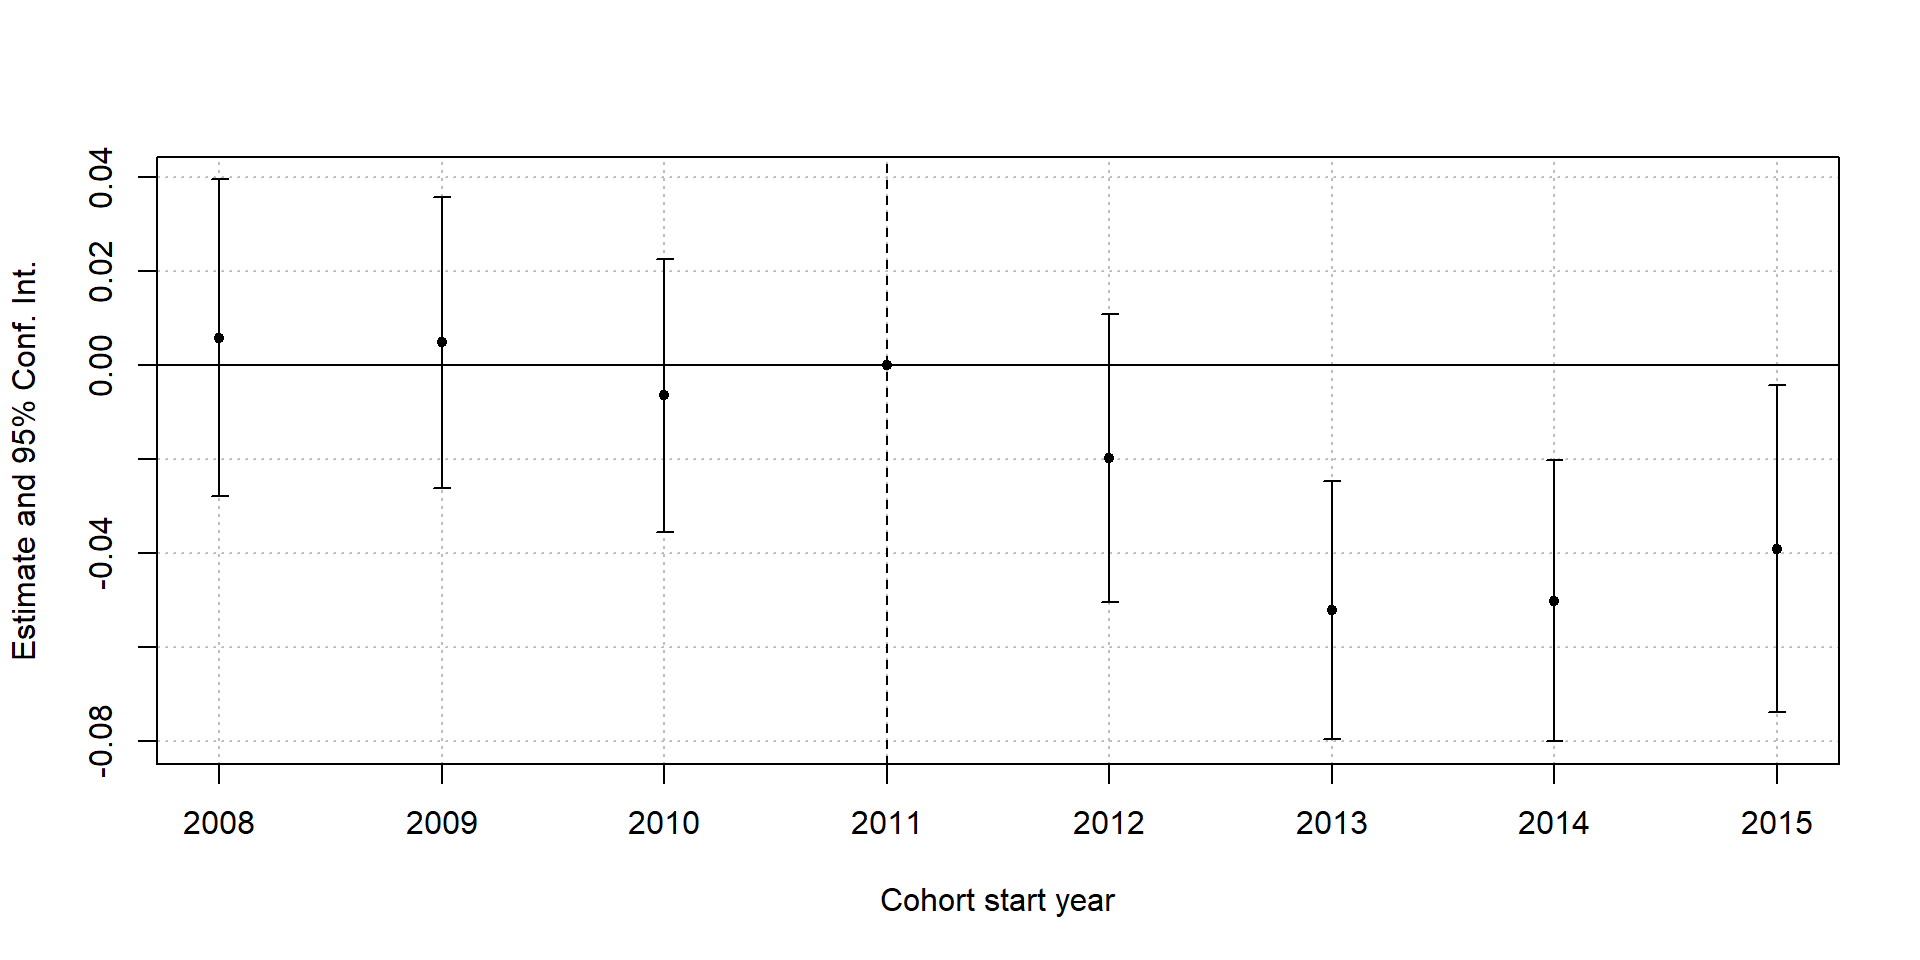
Parallel trends, formally
What should the pre-reform coefficients look like if the assumption holds — and what would you conclude if one were significant?
Four outcomes, one specification
Aim: the same two-way fixed effects model for four outcomes, clustered by framework — with the earnings model weighted by the number of completers behind each cell mean.
What do the framework and year fixed effects absorb? Why are there no sector or level controls? And why does the earnings model carry weights when the others do not?
Show the code
m_starts <- feols(log(starts) ~ did | framework_id + start_year,
    data = panel, cluster = ~framework_id
)
m_comp <- feols(completion ~ did | framework_id + start_year,
    data = panel, cluster = ~framework_id
)
m_ach <- feols(achievement ~ did | framework_id + start_year,
    data = panel, cluster = ~framework_id
)
m_earn <- feols(log_earn ~ did | framework_id + start_year,
    data = panel, weights = ~n_earn, cluster = ~framework_id
)

etable(m_starts, m_comp, m_ach, m_earn, digits = 3, fitstat = ~n)
#> m_starts m_comp m_ach m_earn
#> Dependent Var.: log(starts) completion achievement log_earn
#>
#> did -0.168*** (0.016) -0.041*** (0.008) -0.052*** (0.009) 0.064*** (0.007)
#> Fixed-Effects: ----------------- ----------------- ----------------- ----------------
#> framework_id Yes Yes Yes Yes
#> start_year Yes Yes Yes Yes
#> _______________ _________________ _________________ _________________ ________________
#> S.E.: Clustered by: framework_id by: framework_id by: framework_id by: framework_id
#> Observations 640 640 640 640
#> ---
#> Signif. codes: 0 '***' 0.001 '**' 0.01 '*' 0.05 '.' 0.1 ' ' 1Fewer complete, yet completers earn more
Fewer people start. Fewer complete. Fewer achieve.
And yet those who do complete earn more.
Discussion in threes — 5 minutes
What is going on? Give me two competing explanations, and say what you would look at to tell them apart.
Composition or a real earnings gain?
Aim: by group and period, the share of starters who reach the earnings sample, and the prior attainment of those who do.
Show the code
starts |>
    left_join(framework_pre, by = "framework_id") |>
    mutate(
        period = ifelse(start_year >= 2012, "Post", "Pre"),
        group = ifelse(affected == 1, "Affected", "Unaffected")
    ) |>
    group_by(group, period) |>
    summarise(
        starts = n(),
        pct_with_earnings = round(100 * mean(!is.na(earnings_12m)), 1),
        prior_of_earners = round(mean(as.numeric(prior_attain)[!is.na(earnings_12m)],
            na.rm = TRUE
        ), 2),
        .groups = "drop"
    )
#> # A tibble: 4 × 5
#> group period starts pct_with_earnings prior_of_earners
#> <chr> <chr> <int> <dbl> <dbl>
#> 1 Affected Post 29295 49.6 10.2
#> 2 Affected Pre 31938 54.6 9.94
#> 3 Unaffected Post 30553 57.1 10.7
#> 4 Unaffected Pre 28215 58.2 10.4- The people we observe earning changed: the share reaching the earnings sample falls 5 points in affected frameworks, 1 point elsewhere
- But their observable prior attainment moves the same in both groups
- In the data we built, the true direct effect on earnings is +0.062. The plain 2×2 gives +0.070, so about +0.008 — a tenth, not a fifth — is composition, on things you cannot see
Robustness: does the specification matter?
Aim: the plain 2×2 interaction on the same panel, with the same weights, beside the two-way fixed effects model.
When would the two disagree — and why should they agree here?
Show the code
#>                              simple             m_earn
#> Dependent Var.:            log_earn           log_earn
#>
#> Constant          9.697*** (0.0452)
#> affected            0.0521 (0.0625)
#> post            -0.0237*** (0.0049)
#> affected x post  0.0700*** (0.0072)
#> did                                 0.0641*** (0.0065)
#> Fixed-Effects:  ------------------- ------------------
#> framework_id                     No                Yes
#> start_year                       No                Yes
#> _______________ ___________________ __________________
#> S.E.: Clustered    by: framework_id   by: framework_id
#> Observations                    640                640
#> ---
#> Signif. codes: 0 '***' 0.001 '**' 0.01 '*' 0.05 '.' 0.1 ' ' 1- The plain 2×2 and the two-way fixed effects model agree to within a standard error
- Expected here: a single national reform date means no staggered adoption, so the two-way fixed effects problems from Module 3 do not arise
Robustness: a placebo reform
Pairs — 5 minutes
Pretend the reform happened in 2011 instead. Using only pre-reform years, is there an effect on completion?
Show the code
#>          Estimate Std. Error t value Pr(>|t|)
#> fake_did  -0.0014     0.0123 -0.1178   0.9065
#> attr(,"type")
#> [1] "Clustered (framework_id)"Reporting this to a policy audience
| Finding | Magnitude | Confidence |
|---|---|---|
| Starts | Down ~17% | Very high |
| Completion rate | Down ~4pp | High |
| Achievement rate | Down ~5pp | High |
| Earnings of completers | Up ~6% | High, but partly composition |
- Lead with the trade-off, not with one number: the reform raised quality per apprenticeship and reduced volume
- Whether that is a good deal depends on what the programme is for — a political question, not a statistical one
Exercise 2: what you did
- Defined treatment from pre-reform data only, so the reform could not define its own treated group
- Checked the policy actually changed behaviour before looking at any outcome
- Built a panel, assessed parallel trends by eye and with an event study
- Estimated four outcomes with one specification, weighted the one whose cells changed size, and read them together
- Found a result that looked like an unambiguous success, and took it apart
- Ran a placebo, and saw why a null there is the good outcome
If you are ahead — four extensions in the appendix: frameworks near the 12-month threshold, effects by sector, earnings for everyone who started, and an event study on earnings.
Exercise 3: Regression Discontinuity
Born a day apart
England admits children to school by a 1 September cutoff.
- A child born 31 August is the youngest in their cohort
- A child born 1 September is the oldest in the next one
Two children born a day apart are near-identical in every respect except where they sit in their year group — and that is assigned by a date nobody chose with schooling in mind.
The question: does being young for your year affect attainment, and identification of special educational needs?
Build the running variable
#> [1] 80000 9#> [1] "pupil_id" "date_of_birth" "cohort_year" "gender" "ethnic"
#> [6] "fsm6" "idaci_rank" "ks2_score" "sen_support"On your own — 5 minutes
Build the running variable: days from 1 September, negative for children born before it and zero or positive for those born on or after. Check its range, and the share on each side.
Before anything else: can people sort themselves?
Aim: test for a jump in the density of the running variable at zero.
Predict first: what would manipulation look like in a histogram of birth dates?
#>
#> Manipulation testing using local polynomial density estimation.
#>
#> Number of obs =       80000
#> Model =               unrestricted
#> Kernel =              triangular
#> BW method =           estimated
#> VCE method =          jackknife
#>
#> c = 0                 Left of c           Right of c
#> Number of obs         42342               37658
#> Eff. Number of obs    10970               9308
#> Order est. (p)        2                   2
#> Order bias (q)        3                   3
#> BW est. (h)           46.957              40.505
#>
#> Method                T                   P > |T|
#> Robust 0.9539 0.3401- If parents could time births to land the right side of 1 September, the children either side would no longer be comparable
Non-uniform is not the same as manipulated
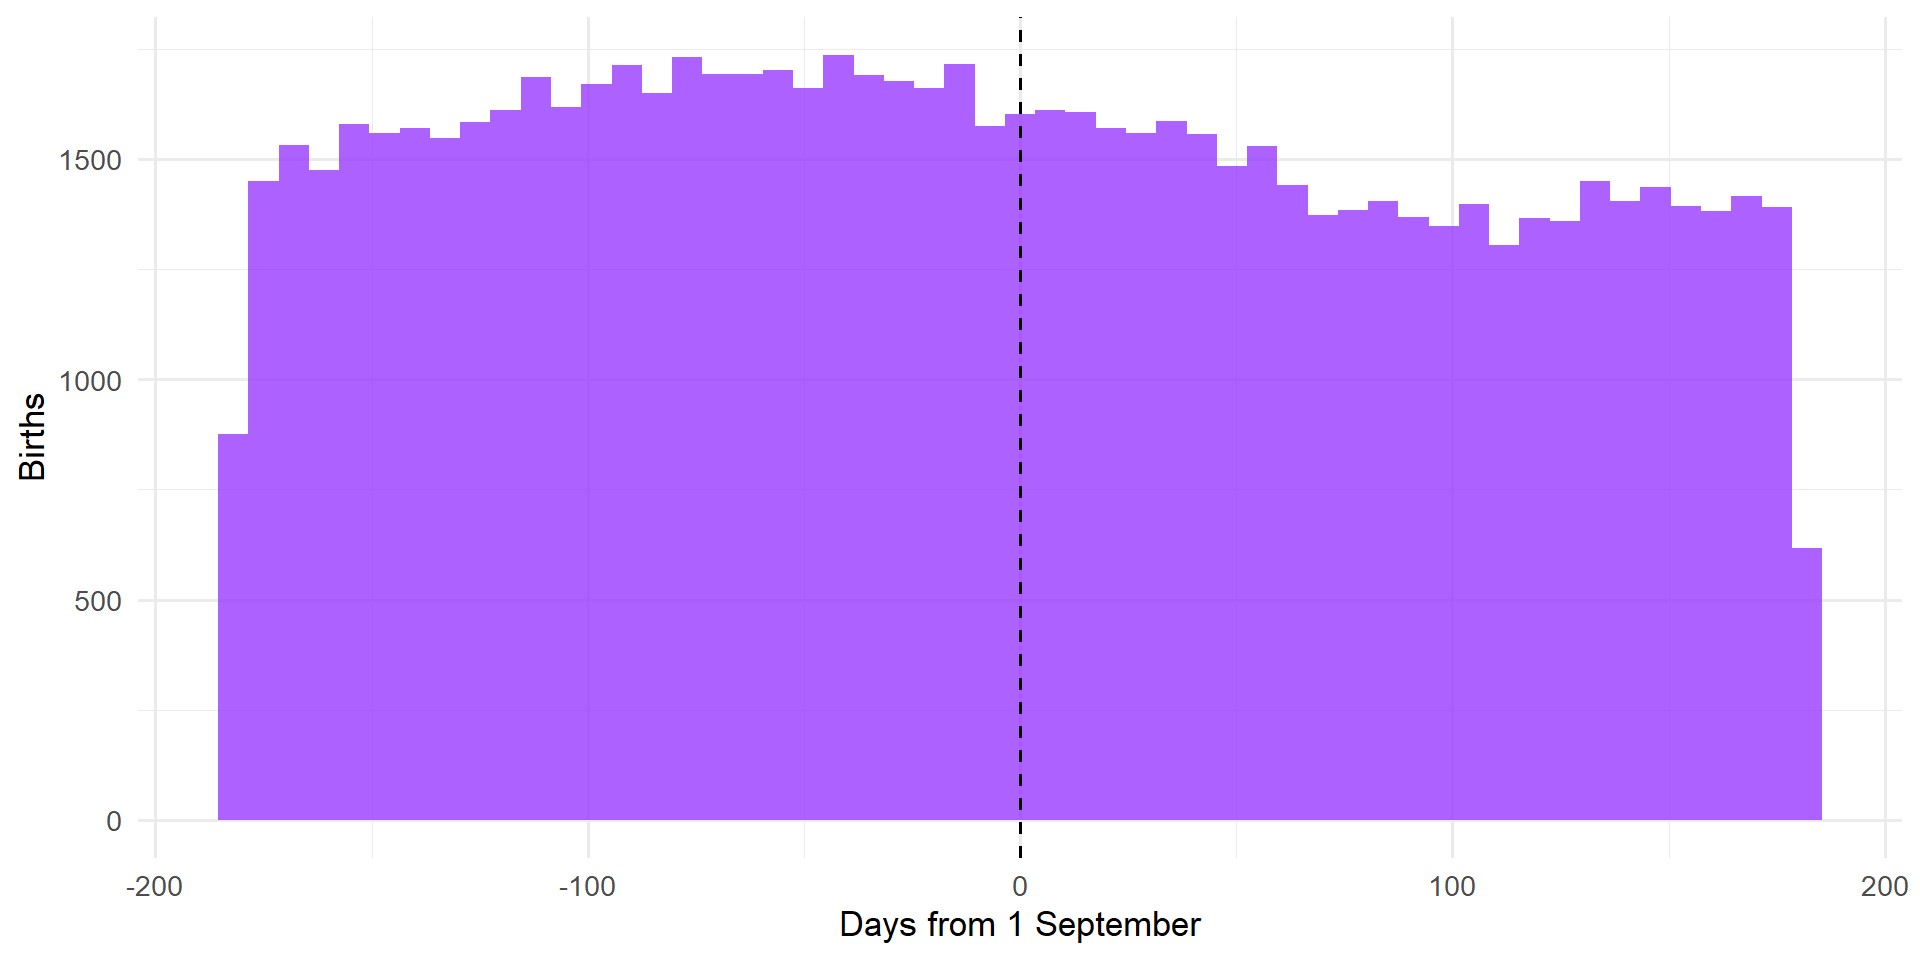
- The distribution is visibly not flat — births peak in late summer, as they really do
- But there is no step at the threshold, and a step is the only thing that would threaten the design
Plot the discontinuity
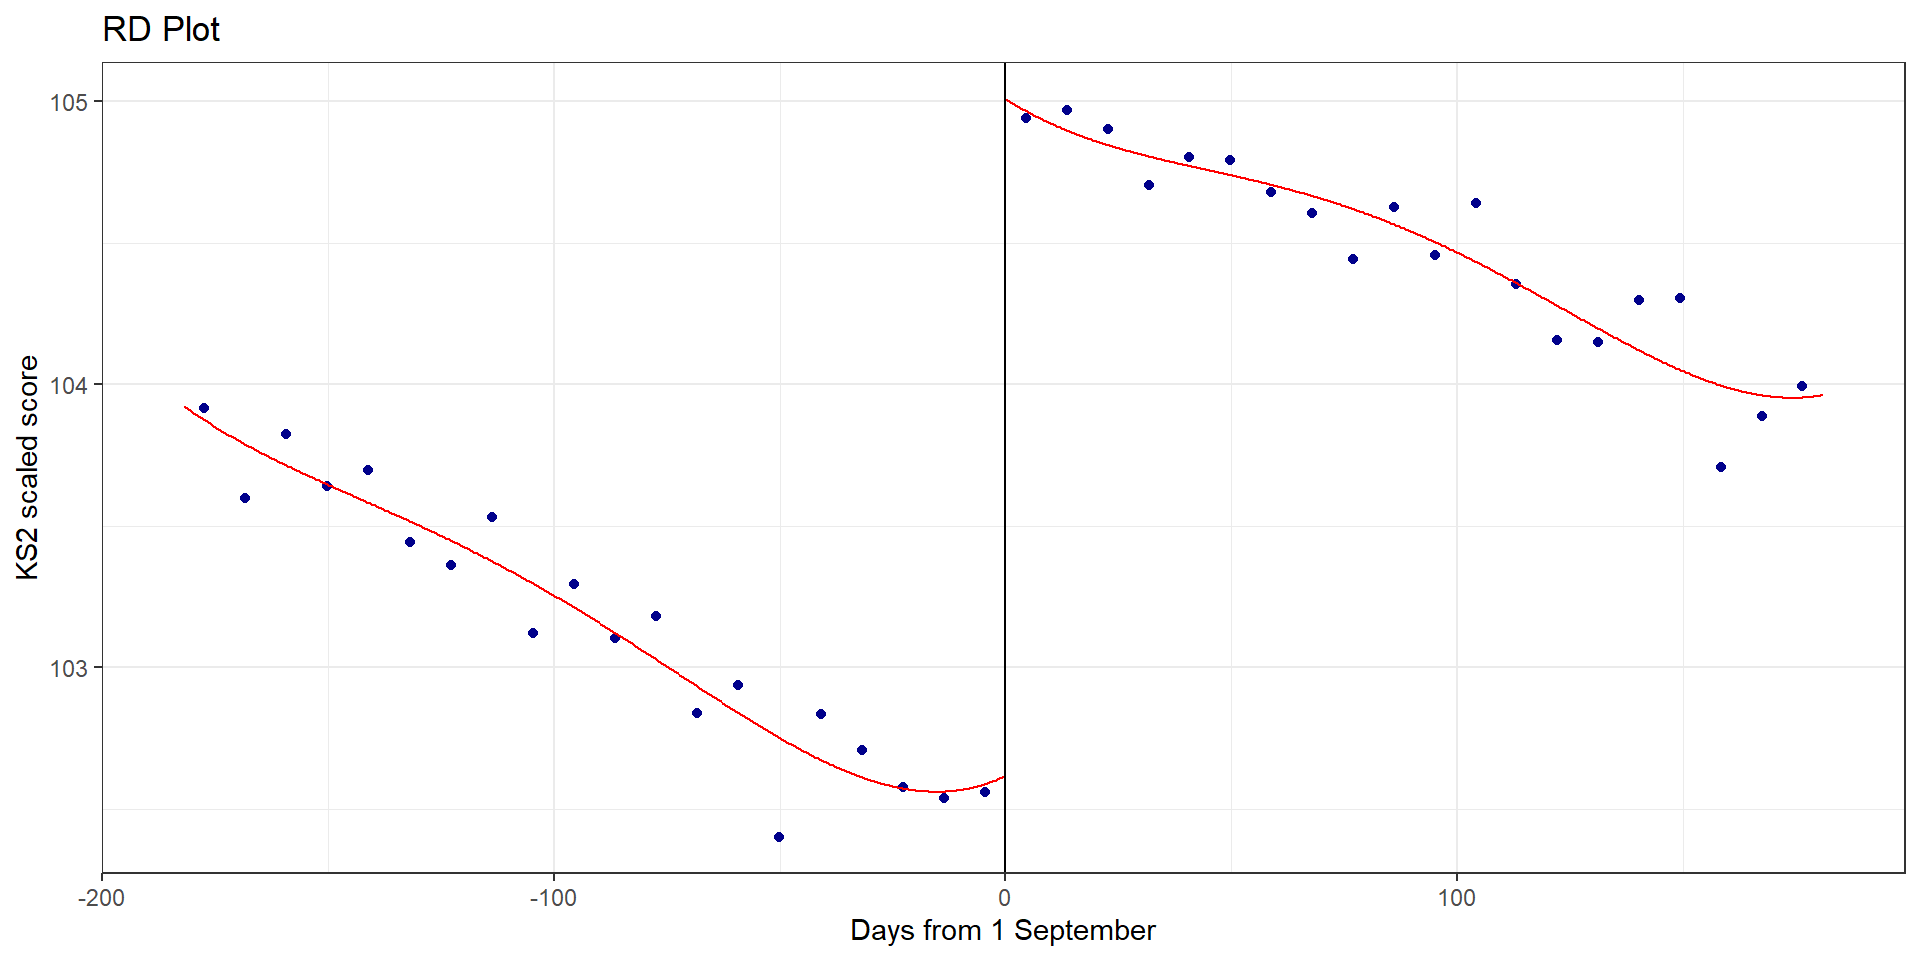
Aim: the mean KS2 score in bins of the running variable, either side of the cutoff, with a fitted line on each side.
Two things to read off: the jump at zero, and the slope within each side. What is the slope?
Bins: too few, too many
Show the code
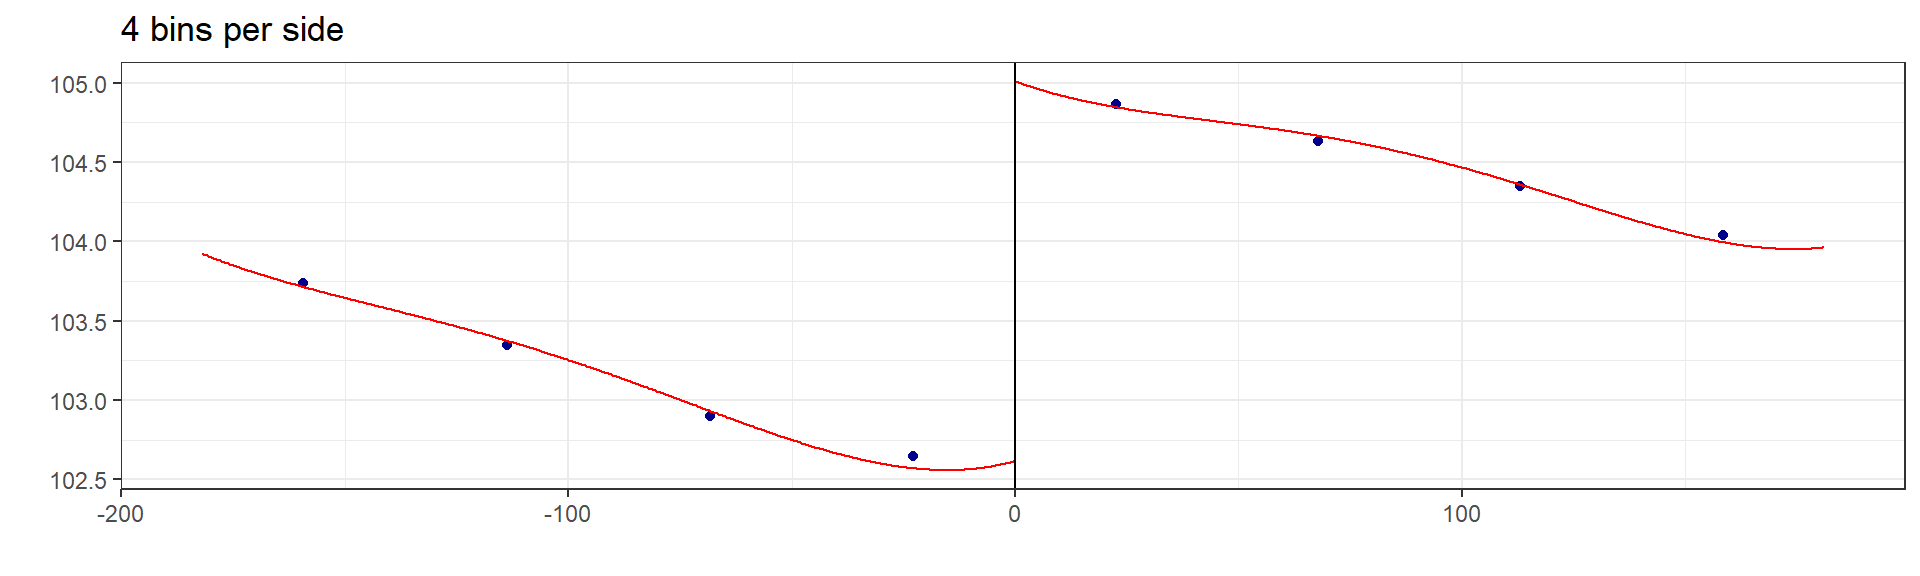
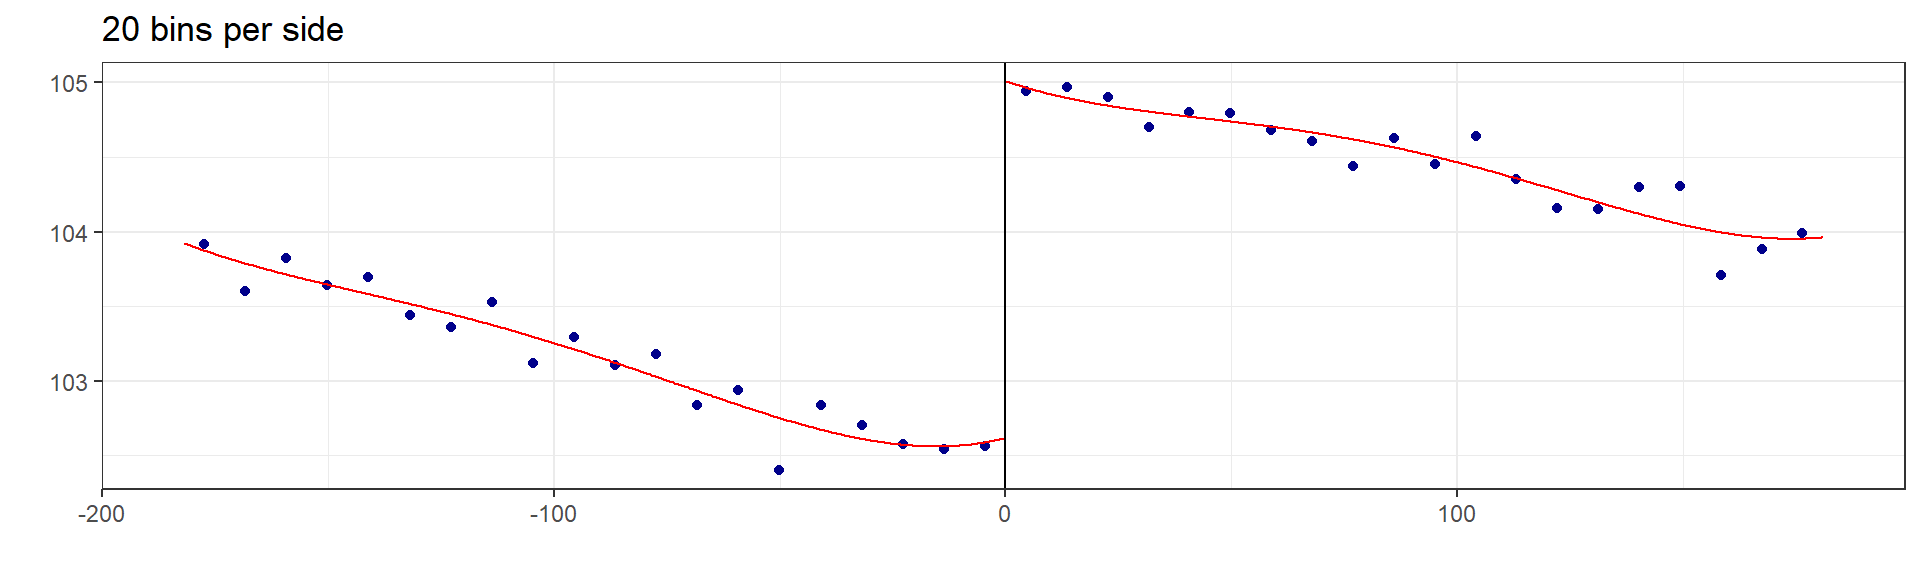
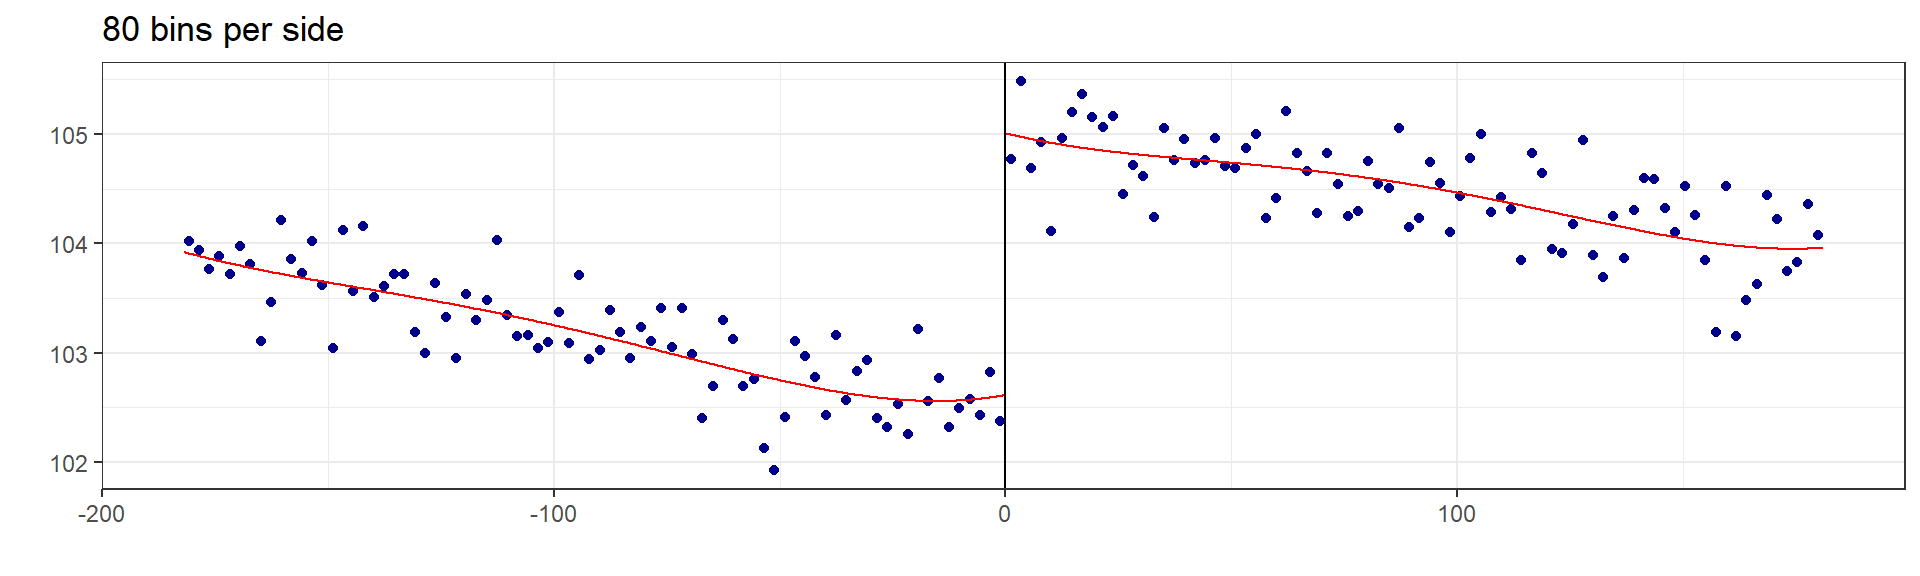
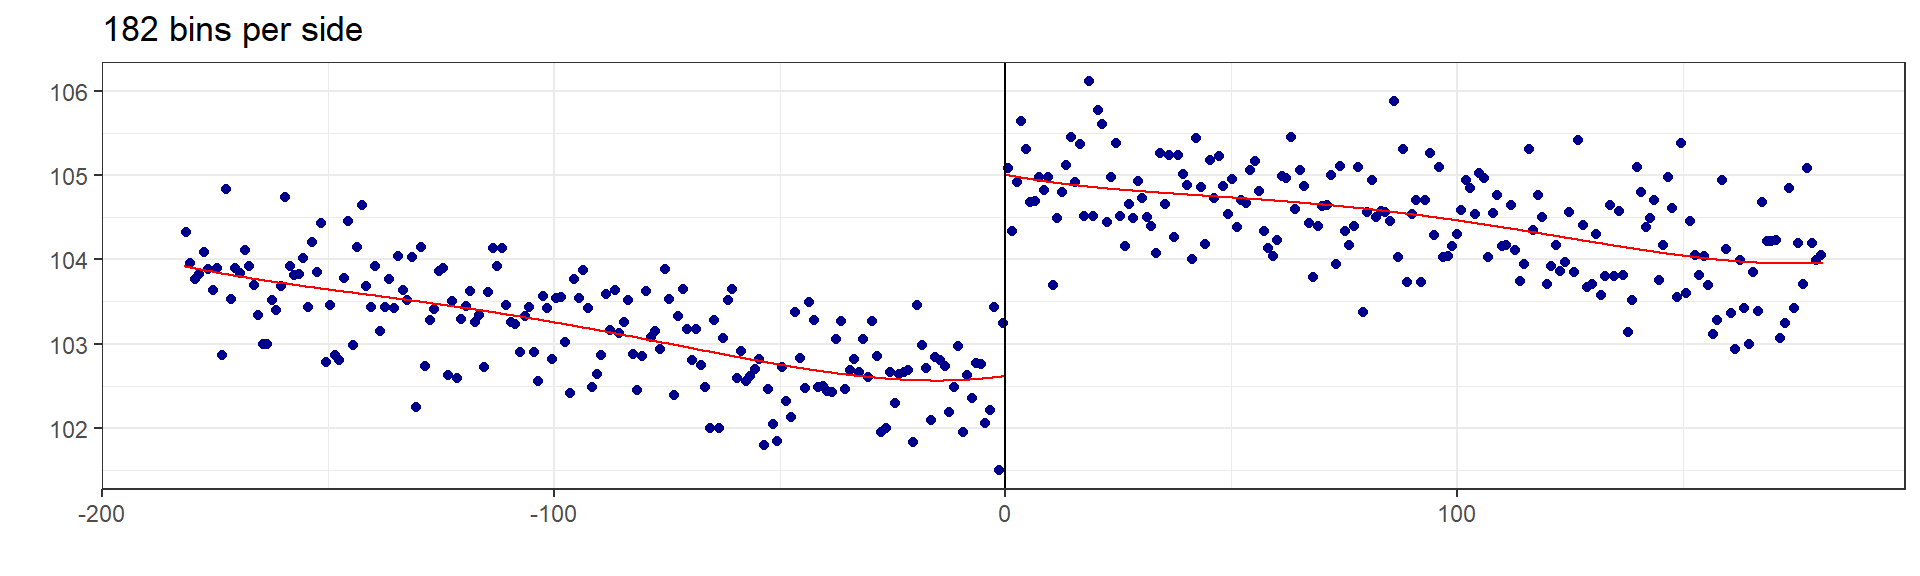
- 4 bins: the jump is there, but four points tell you nothing about the noise, and the fitted curve is doing all the work
- 182 bins (one per day): honest about the noise, hard to read
- 20 is a choice, not a fact.
rdplot’s default picks the number that mimics the variance of the raw data. A bin must never straddle the cutoff
Local linear estimate at the cutoff
Which of the three rows do you report, and why?
#> Call: rdrobust
#>
#> Sharp RD estimates using local polynomial regression.
#>
#> Number of Obs.                80000
#> BW type                       mserd
#> Kernel                   Triangular
#> VCE method                       NN
#>
#>                                Left        Right
#> Number of Obs.                42342        37658
#> Eff. Number of Obs.           15796        14862
#> Order est. (p)                    1            1
#> Order bias (q)                    2            2
#> BW est. (h)                  66.108       66.108
#> BW bias (b)                 107.568      107.568
#> rho (h/b)                     0.615        0.615
#> Unique Obs.                     182          182
#>
#> =======================================================================================
#>         Method     Coef. Std. Err.         z     P>|z|      [ 95% C.I. ]
#> =======================================================================================
#>   Conventional     2.425     0.175    13.878     0.000     [2.083 , 2.768]
#> Bias-Corrected     2.377     0.175    13.601     0.000     [2.034 , 2.719]
#>         Robust     2.377     0.206    11.555     0.000     [1.974 , 2.780]
#> =======================================================================================- Local linear regression either side of the cutoff, weighted by a triangular kernel so points nearest the threshold count most
- The bandwidth is chosen by the data, not by you — report which one, and why
Bandwidth sensitivity and covariate placebos
Aim: the estimate at half and double the chosen bandwidth; then the same estimator with FSM and IDACI as the outcome.
Show the code
#> h = 33.1 days est = 2.353 p = 0.0000#> h = 66.1 days est = 2.425 p = 0.0000#> h = 132.2 days est = 2.542 p = 0.0000SEN identification at the cutoff
Aim: the same estimator with SEN support as the outcome.
Which direction do you expect — and so what sign will the coefficient carry?
#> Call: rdrobust
#>
#> Sharp RD estimates using local polynomial regression.
#>
#> Number of Obs.                80000
#> BW type                       mserd
#> Kernel                   Triangular
#> VCE method                       NN
#>
#>                                Left        Right
#> Number of Obs.                42342        37658
#> Eff. Number of Obs.           12403        11891
#> Order est. (p)                    1            1
#> Order bias (q)                    2            2
#> BW est. (h)                  52.306       52.306
#> BW bias (b)                  81.590       81.590
#> rho (h/b)                     0.641        0.641
#> Unique Obs.                     182          182
#>
#> =====================================================================
#>                    Point    Robust Inference
#>                 Estimate         z     P>|z|      [ 95% C.I. ]
#> ---------------------------------------------------------------------
#>      RD Effect    -0.041    -3.830     0.000    [-0.064 , -0.021]
#> =====================================================================- Children who are youngest in their cohort are more likely to be identified as having special educational needs
- Same date of birth, same child — different position in the year group, different chance of being labelled
What did you actually identify?
Across 1 September, three things change at once:
- Relative age — youngest in the cohort becomes oldest in the next
- Absolute age at test — the September-born child sits KS2 nearly a year older
- The year the test is sat — a different cohort, a different paper, a different school year
The design identifies their combined effect. It cannot separate them.
This is why the published literature decomposes date-of-birth effects rather than reporting a single cutoff estimate.
Exercise 3: what you did
- Built and centred a running variable, and checked it before touching an outcome
- Tested for manipulation, and learned that non-uniform is not the same as manipulated
- Looked before estimating, and saw why the bins are a choice
- Estimated a local linear jump, and reported the right row
- Checked bandwidth sensitivity and covariate smoothness, and saw what passing looks like
- Worked out what the discontinuity is actually an estimate of
If you are ahead — four extensions in the appendix: placebo cutoffs, a different polynomial and kernel, covariates and a donut, and the estimate by gender.
Wrap-Up
What you did today
- Checked the data you were sent matched the design you were told about — and found two schools missing
- Estimated an ITT effect and watched covariate adjustment change the conclusion
- Clustered standard errors at the level of randomisation, and saw what ignoring that would have cost
- Distinguished attrition that is non-random from attrition that is differential
- Built a panel, assessed parallel trends, ran an event study and a placebo test
- Found a result that looked like an unambiguous success, and took it apart
- Found a discontinuity, checked nobody could sort across it, and then worked out what it was actually an estimate of
Taking it further
Everything from today
- Slides, the data, the solution scripts and the generator that made the data are all in the workshop repository — take the folder with you
- The code you wrote today keeps working, because the data is not going anywhere
- The appendix has twelve extensions, all with working code
Where to go next
- The online modules cover the theory in more depth: Module 2 for the morning, Module 3 for the afternoon, Module 4 for the last exercise
- For real data: ADR UK for administrative data access, the ONS Secure Research Service for LEO itself
Thank you
Jake Anders, Oliver Cassagneau-Francis, Fabien Petit UCL Centre for Education Policy & Equalising Opportunities
ADR Evaluation Extension
Appendix: If You Are Ahead
Exercise 1: the pre-specified subgroup
Aim: interact treatment with FSM eligibility in the adjusted model. Anders et al. pre-specified FSM as the primary subgroup; everything else was exploratory.
Why an interaction rather than two separate regressions?
Show the code
#>                   Estimate Std. Error t value Pr(>|t|)
#> armtreatment         2.098      0.848   2.475    0.015
#> armtreatment:fsm6 -0.782 0.794 -0.985 0.326- No evidence the effect differs by FSM status: the interaction is small, negative, and nowhere near significant
- One pre-specified subgroup is a test. Twelve post-hoc subgroups is a fishing expedition
Exercise 1: multiple imputation with mice
Aim: impute the 673 missing KS2 scores five times, with treatment arm in the imputation model, fit the adjusted model on each, and pool with Rubin’s rules.
Show the code
library(mice)
imp_dat <- analysis |>
    select(attainment8, arm, ks2_score, fsm6, sen_support, eal, idaci_rank) |>
    mutate(arm = factor(arm))
imp <- mice(imp_dat, m = 5, method = "pmm", seed = 1, printFlag = FALSE)

fits <- lapply(1:5, \(i) {
    complete(imp, i) |>
        mutate(school_urn = analysis$school_urn, block = analysis$block) |>
        feols(attainment8 ~ arm + ks2_score + fsm6 + sen_support + eal | block,
            data = _, cluster = ~school_urn
        )
})

## Rubin's rules by hand, because pool() does not know about clustered fixest models
est <- sapply(fits, \(f) coef(f)[["armtreatment"]])
v <- sapply(fits, \(f) se(f)[["armtreatment"]]^2)
round(c(
    estimate = mean(est), se = sqrt(mean(v) + (1 + 1 / 5) * var(est)),
    complete_case = coef(m3)[["armtreatment"]], cc_se = se(m3)[["armtreatment"]]
), 3)
#> estimate se complete_case cc_se
#> 1.884 0.798 1.887 0.804- Nothing changes. With 2.7% of a covariate missing and the outcome complete, imputation cannot add much
- The point is the workflow: arm in the imputation model, pool properly, and keep the clustering
Exercise 1: randomisation inference
Aim: re-randomise treatment across schools within blocks 200 times, refit, and place the observed estimate in that null distribution.
Show the code
schools_arm <- analysis |> distinct(school_urn, block, arm)
observed <- coef(m3)[["armtreatment"]]

set.seed(20260910)
null <- replicate(200, {
    fake <- schools_arm |>
        group_by(block) |>
        mutate(arm = sample(arm)) |>
        ungroup()
    d <- analysis |>
        select(-arm) |>
        left_join(fake, by = c("school_urn", "block"))
    coef(feols(attainment8 ~ arm + ks2_score + fsm6 + sen_support + eal | block,
        data = d
    ))[["armtreatment"]]
})

round(c(
    observed = observed, p_randomisation = mean(abs(null) >= abs(observed)),
    p_model = pvalue(m3)[["armtreatment"]]
), 3)
#> observed p_randomisation p_model
#> 1.887 0.015 0.020- The randomisation p-value needs no asymptotics and no assumption about the error structure — it uses only the fact that assignment was random
- It agrees with the clustered p-value here, because 138 clusters is plenty. With 12 local authorities it would not, and this is the one to trust
Exercise 1: are the models on the same sample?
Aim: refit the unadjusted model on the pupils the adjusted model actually used. Is the gap between 1.31 and 1.89 adjustment, or a different sample?
Show the code
#>   Estimate Std. Error    t value   Pr(>|t|)
#> 1.310 1.571 0.834 0.406- The unadjusted estimate on the common sample is close to the full-sample one: the difference is adjustment, not composition
- Worth doing in any report where covariates carry missingness
Exercise 2: frameworks near the threshold
Aim: restrict to frameworks whose pre-reform duration was between 9 and 15 months, where affected and unaffected are most alike, and re-estimate completion and earnings.
The appendix works on the individual rows (ind) rather than the panel: with weights they give the same answers, and the subsetting is easier to read.
Show the code
#> [1] 34Show the code
#>                         near_comp         near_earn
#> Dependent Var.:        completion log(earnings_12m)
#>
#> did             -0.048*** (0.007)     0.034 (0.034)
#> Fixed-Effects:  ----------------- -----------------
#> framework_id                  Yes               Yes
#> start_year                    Yes               Yes
#> _______________ _________________ _________________
#> S.E.: Clustered  by: framework_id  by: framework_id
#> Observations               53,706            27,131
#> ---
#> Signif. codes: 0 '***' 0.001 '**' 0.01 '*' 0.05 '.' 0.1 ' ' 1- Completion holds up. The earnings effect is the same size but no longer significant: 34 clusters, and the interval has doubled
- A robustness check that “fails” on power rather than on sign is not a failure, and you say so
Exercise 2: effects by sector
Aim: the completion effect separately for the five largest sector subject areas, in one model.
Show the code
frameworks <- read_csv("data/framework_lookup.csv", show_col_types = FALSE)
ind_sector <- ind |>
    left_join(select(frameworks, framework_id, ssa_tier1), by = "framework_id")
top5 <- ind_sector |>
    count(ssa_tier1, sort = TRUE) |>
    slice_head(n = 5) |>
    pull(ssa_tier1)

feols(completion ~ did:ssa_tier1 | framework_id + start_year,
    data = filter(ind_sector, ssa_tier1 %in% top5), cluster = ~framework_id
) |>
    coeftable() |>
    (\(x) round(x[, 1:2], 3))()
#> Estimate Std. Error
#> did:ssa_tier1Business, Administration and Law -0.046 0.014
#> did:ssa_tier1Construction, Planning and the Built Environment -0.043 0.006
#> did:ssa_tier1Engineering and Manufacturing Technologies -0.031 0.015
#> did:ssa_tier1Leisure, Travel and Tourism -0.046 0.004
#> did:ssa_tier1Retail and Commercial Enterprise -0.047 0.007- Every sector’s completion rate fell by three to five points. The effect is not being carried by one sector
- Sector is in the framework lookup, not the starts file: a join you would have to do in the ILR too
Exercise 2: earnings for everyone who started
Aim: earnings in pounds, counting non-completers and those without a PAYE record as zero, for every start.
Show the code
#>     Estimate Std. Error t value Pr(>|t|)
#> did   -97.65     125.21   -0.78     0.44
#> attr(,"type")
#> [1] "Clustered (framework_id)"- Nothing: about −£100 on a base of £10,300, with an interval that spans zero comfortably
- Higher earnings for completers and fewer completers cancel out. This answers a different question — what did the reform do to the earnings of a person who started — and it is the question a Treasury analyst would ask
Exercise 2: an event study on earnings
Aim: the event study from the main flow, on log earnings at the individual level.
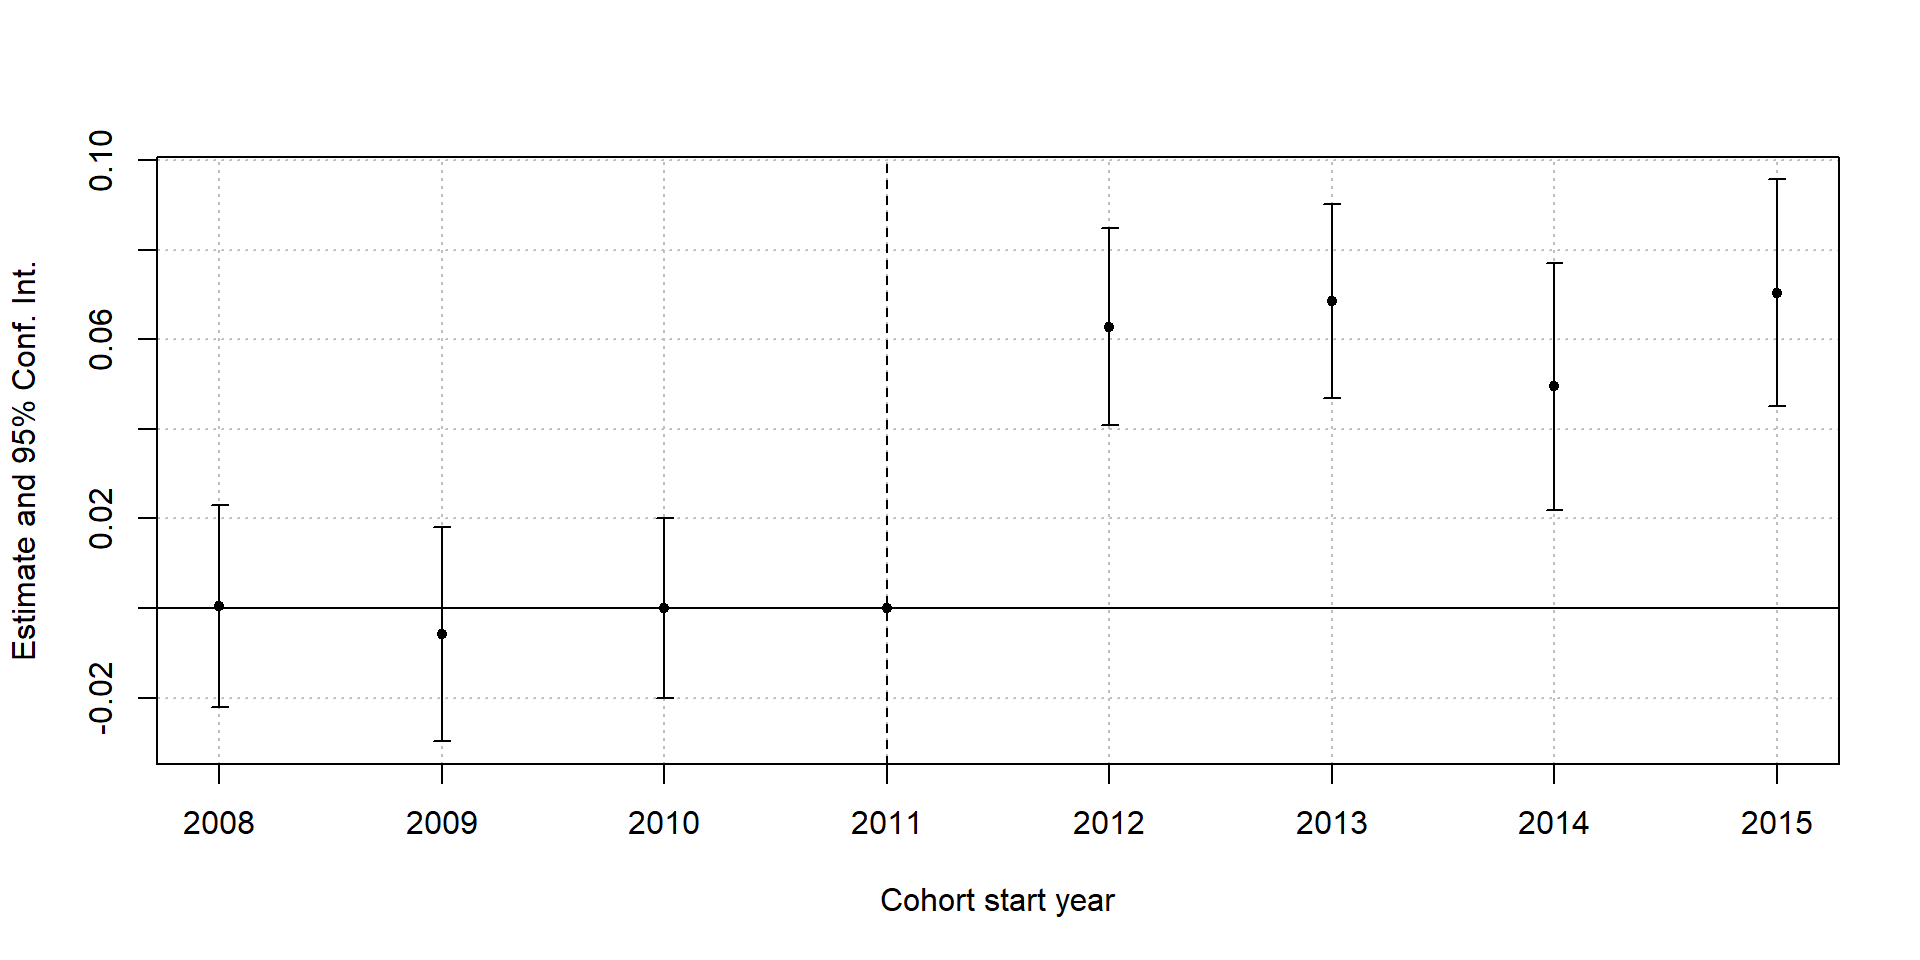
- Flat before, a step of five to seven log points after, and no drift in either direction
- The same check as for completion, and it should be run for every outcome you report
Exercise 3: placebo cutoffs
Aim: estimate the “jump” 120 days either side of the real cutoff — early May and late December, where nothing happens — using only the side of the real cutoff each sits on.
Show the code
#> cutoff at -120 days est = 0.417 p = 0.142#> cutoff at +120 days est = -0.456 p = 0.262- Nothing at either placebo, against 2.4 points at the real one
- Restricting to one side matters: a placebo window that spans the real cutoff would pick up the real jump
Exercise 3: polynomial order and kernel
Aim: the same estimate with a local quadratic, and with a uniform kernel.
Show the code
#> p = 2 triangular h = 88.2 est = 2.364 p = 0.000#> p = 1 uniform h = 40.5 est = 2.467 p = 0.000- A quadratic chooses a wider bandwidth and lands within a tenth of a point; the uniform kernel chooses a narrower one and does the same
- Local linear with a triangular kernel is the default for a reason, and these are the two checks Module 4 asks for
Exercise 3: covariates and a donut
Aim: add FSM, IDACI and gender as covariates; then drop the three days either side of the cutoff and re-estimate.
Show the code
with_covs <- rdrobust(cohort$ks2_score, cohort$days,
    c = 0,
    covs = cbind(cohort$fsm6, cohort$idaci_rank, cohort$gender == "F")
)
donut <- cohort |> filter(abs(days) > 3)
with_donut <- rdrobust(donut$ks2_score, donut$days, c = 0)

tibble(
    spec = c("Baseline", "With covariates", "Donut ±3 days"),
    estimate = c(fit$coef[1], with_covs$coef[1], with_donut$coef[1]),
    se = c(fit$se[3], with_covs$se[3], with_donut$se[3])
) |>
    mutate(across(where(is.numeric), \(x) round(x, 3)))
#> # A tibble: 3 × 3
#> spec estimate se
#> <chr> <dbl> <dbl>
#> 1 Baseline 2.42 0.206
#> 2 With covariates 2.44 0.194
#> 3 Donut ±3 days 2.49 0.261- Covariates tighten the standard error a little and move the estimate not at all — which is what a valid design looks like
- The donut is for suspected manipulation right at the cutoff. Nothing here suggests it, and the estimate does not care
Exercise 3: by gender
Aim: the KS2 and SEN discontinuities separately for girls and boys. The published finding is largest for girls.
Show the code
#> F KS2 jump = 2.11 (p = 0.000) SEN jump = -0.041 (p = 0.012)#> M KS2 jump = 2.70 (p = 0.000) SEN jump = -0.038 (p = 0.003)- Here the KS2 jump is larger for boys and the SEN jump is the same for both — which tells you about our simulation, not about children
- Subsample checks are Module 4’s last robustness item, and the honest use of them is to report all of them, not the one that looks best

In-Person Workshop | UCL CEPEO